In the age of data-driven decision-making, the ability to predict future trends and outcomes is invaluable. Qlik AutoML stands at the forefront of this revolution, offering seamless integration of automated machine learning within the Qlik Cloud Analytics hub. This powerful tool is not just for data scientists; it democratizes predictive analytics, enabling users of all skill levels to uncover patterns, make predictions, and delve into the key features influencing their business outcomes. With Qlik AutoML, you can collaborate, experiment, and deploy machine learning models with unprecedented ease. As you read on, discover how Qlik AutoML's no-code, user-friendly approach is transforming analytics teams, allowing for unlimited experimentation and swift model deployment—unlocking the full potential of your data without the need for expert intervention.
What is Qlik AutoML?
Artificial Intelligence (AI) and Machine Learning (ML) have emerged as pivotal technologies in the realm of data analytics, offering powerful tools to extract actionable insights from complex datasets. AI refers to the simulation of human intelligence processes by machines, enabling them to perform tasks that typically require human intelligence, such as problem-solving, decision-making, and pattern recognition. Within the broader field of AI, ML focuses on the development of algorithms that allow computers to learn from and make predictions or decisions based on historical data.
Qlik AutoML goes beyond traditional ML approaches by offering a comprehensive suite of automated features integrated seamlessly into the Qlik analytics platform. Leveraging Qlik's intuitive user interface, Qlik AutoML enables users of all skill levels to effortlessly build, deploy, and interpret ML models to derive actionable insights from their data. By eliminating the complexities traditionally associated with ML model development, Qlik AutoML empowers businesses to accelerate their journey towards data-driven decision-making and unlock the full potential of their data assets.
Qlik AutoML utilizes two key functionalities: 'experiments' and 'deployments'. Through experiments, users can train models using historical data to analyze and predict business problems. Following the training and refinement process, these models can then be deployed to make predictions on new datasets. Experiments are customizable and can be created within both personal and shared spaces. On the other hand, deployments offer the capability to operationalize these trained models. They can be created within personal, shared, and managed spaces.
Prerequisites for using Qlik AutoML
To work with ML experiments, you must have the following:
- Professional or Full User entitlement
- AutoML Experiment Contributor role (to view ML experiments, you can alternatively have the AutoML Deployment Contributor role instead)
- Permission is required in the space where the experiments are located. You cannot create experiments in a managed space.
To work with ML deployments, you need:
- Professional or Full User entitlement
- View and create ML deployments: AutoML Deployment Contributor or AutoML Experiment Contributor security role
- Edit and delete ML deployments: AutoML Deployment Contributor security role
- Required role in the space where the ML deployment is located.
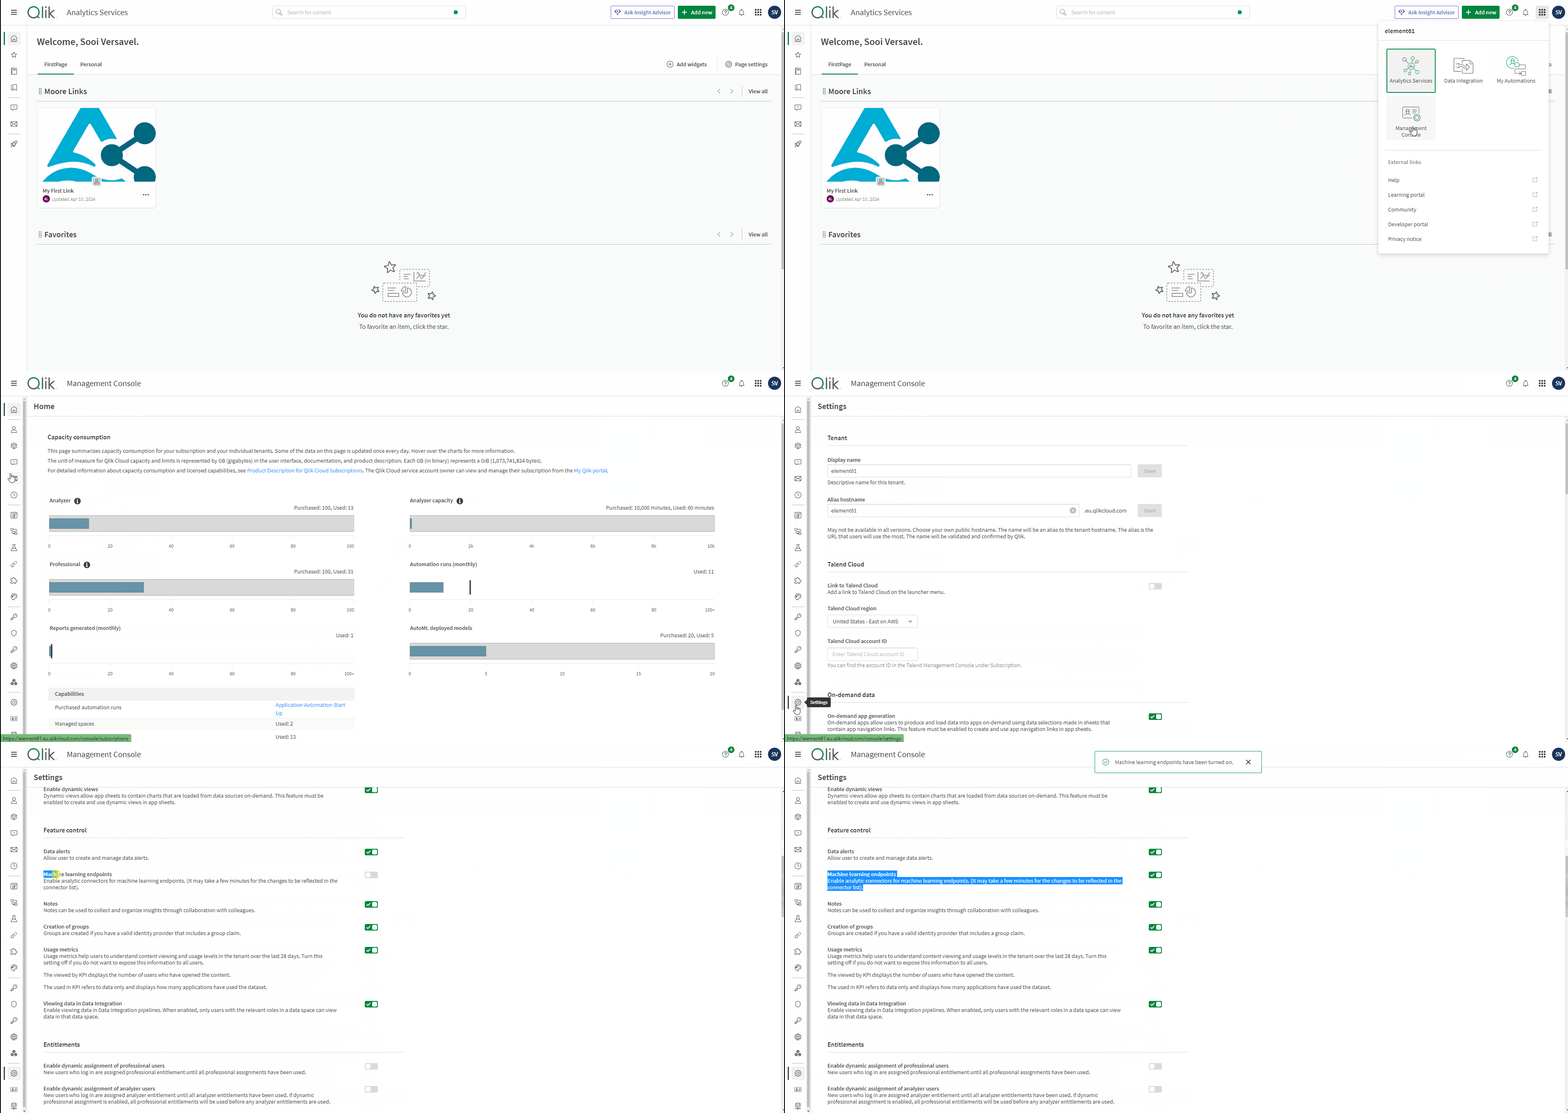
Additionally, your tenant administrator needs to activate the Qlik AutoML functionality for your tenant.
How to use Qlik AutoML: Predicting flight satisfaction
Before utilizing Qlik AutoML, it's necessary to have a well-structured base table in place for machine learning models to effectively learn. The input table serves as the foundation for any machine learning model, emphasizing the importance of the phrase "trash in = trash out."
In the upcoming example, we'll employ a machine-learning-ready dataset sourced from Kaggle. This dataset contains responses from a satisfaction questionnaire, with our objective centred on predicting overall customer satisfaction: Satisfied or Neutral/Dissatisfied.
For further insights into creating an optimal input table for machine learning models, we recommend referring to the information available at Getting your dataset ready for training.
In general, four key elements are essential within the data:
- Event triggers: what prompts the creation of a new data point. In our example, this happens when a customer completes the satisfaction questionnaire.
- Targets: The target you’re trying to predict. Our target is whether a customer is satisfied or neutral/dissatisfied.
- Features: This is the information that’s used to make the prediction, what influences the target.
- Prediction point: The point where you stop collecting data and start predicting the target.
Below you can find a preview of our data. We're trying to predict the 'Satisfaction' column.

Creating experiments
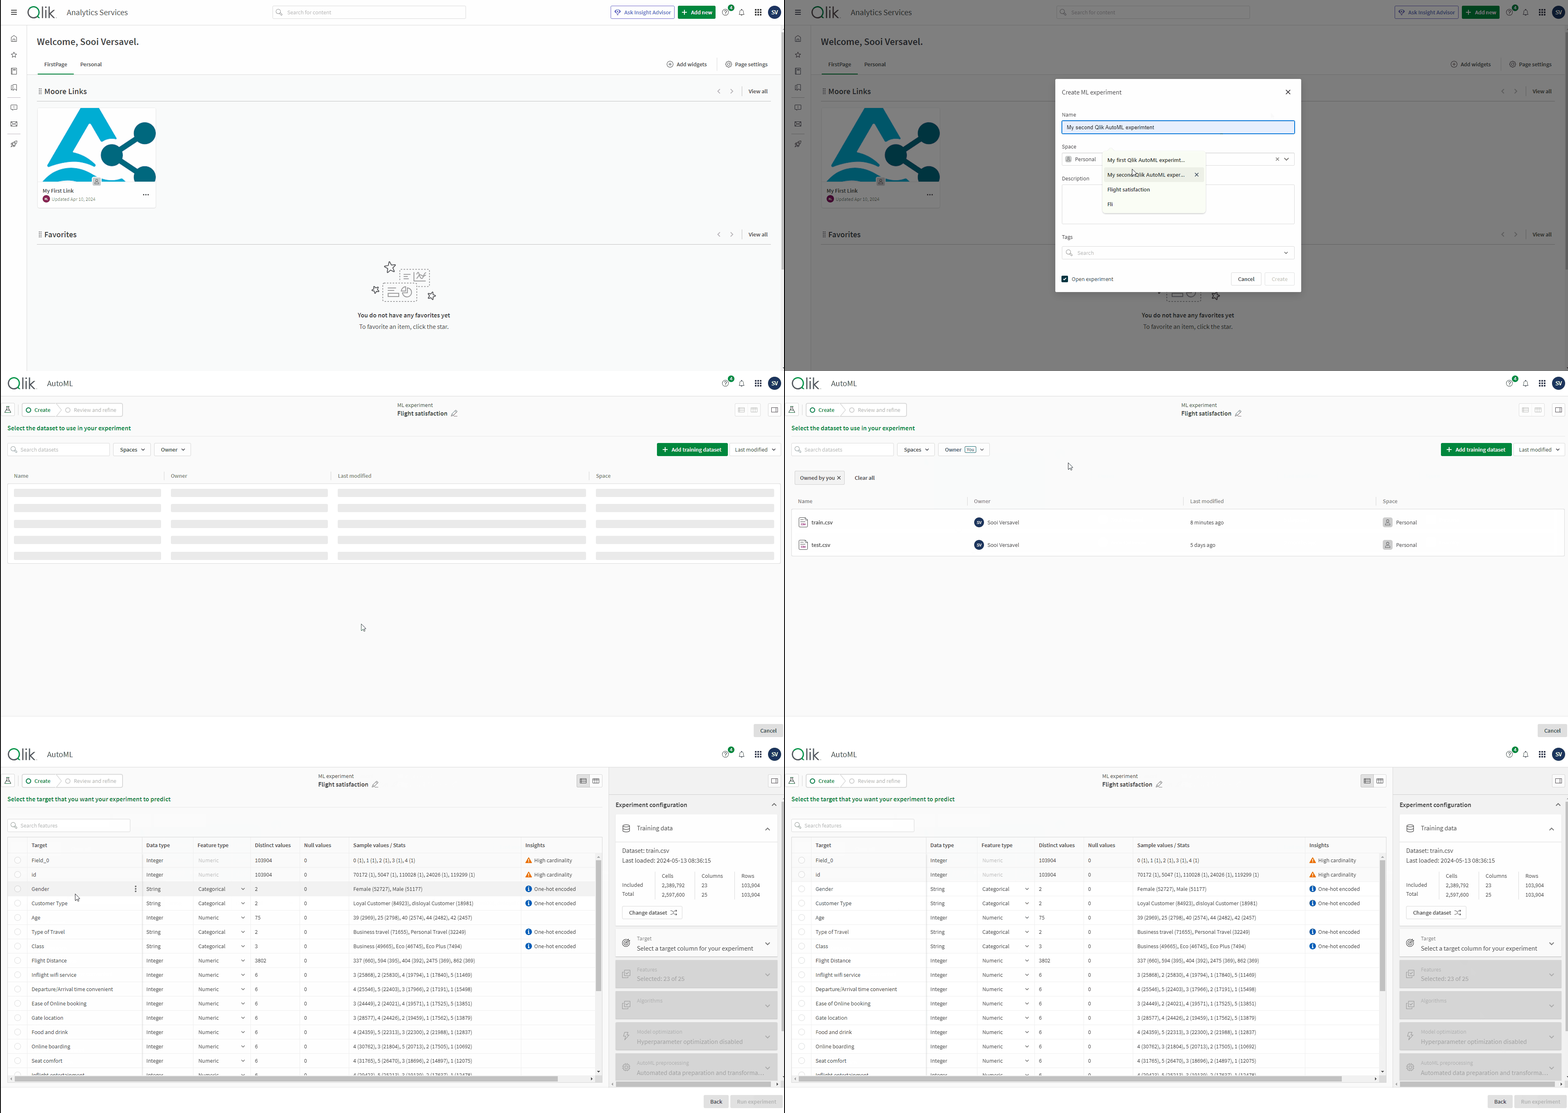
First, you must create an AutoML experiment and load the data used for training the model.
Configuring experiments
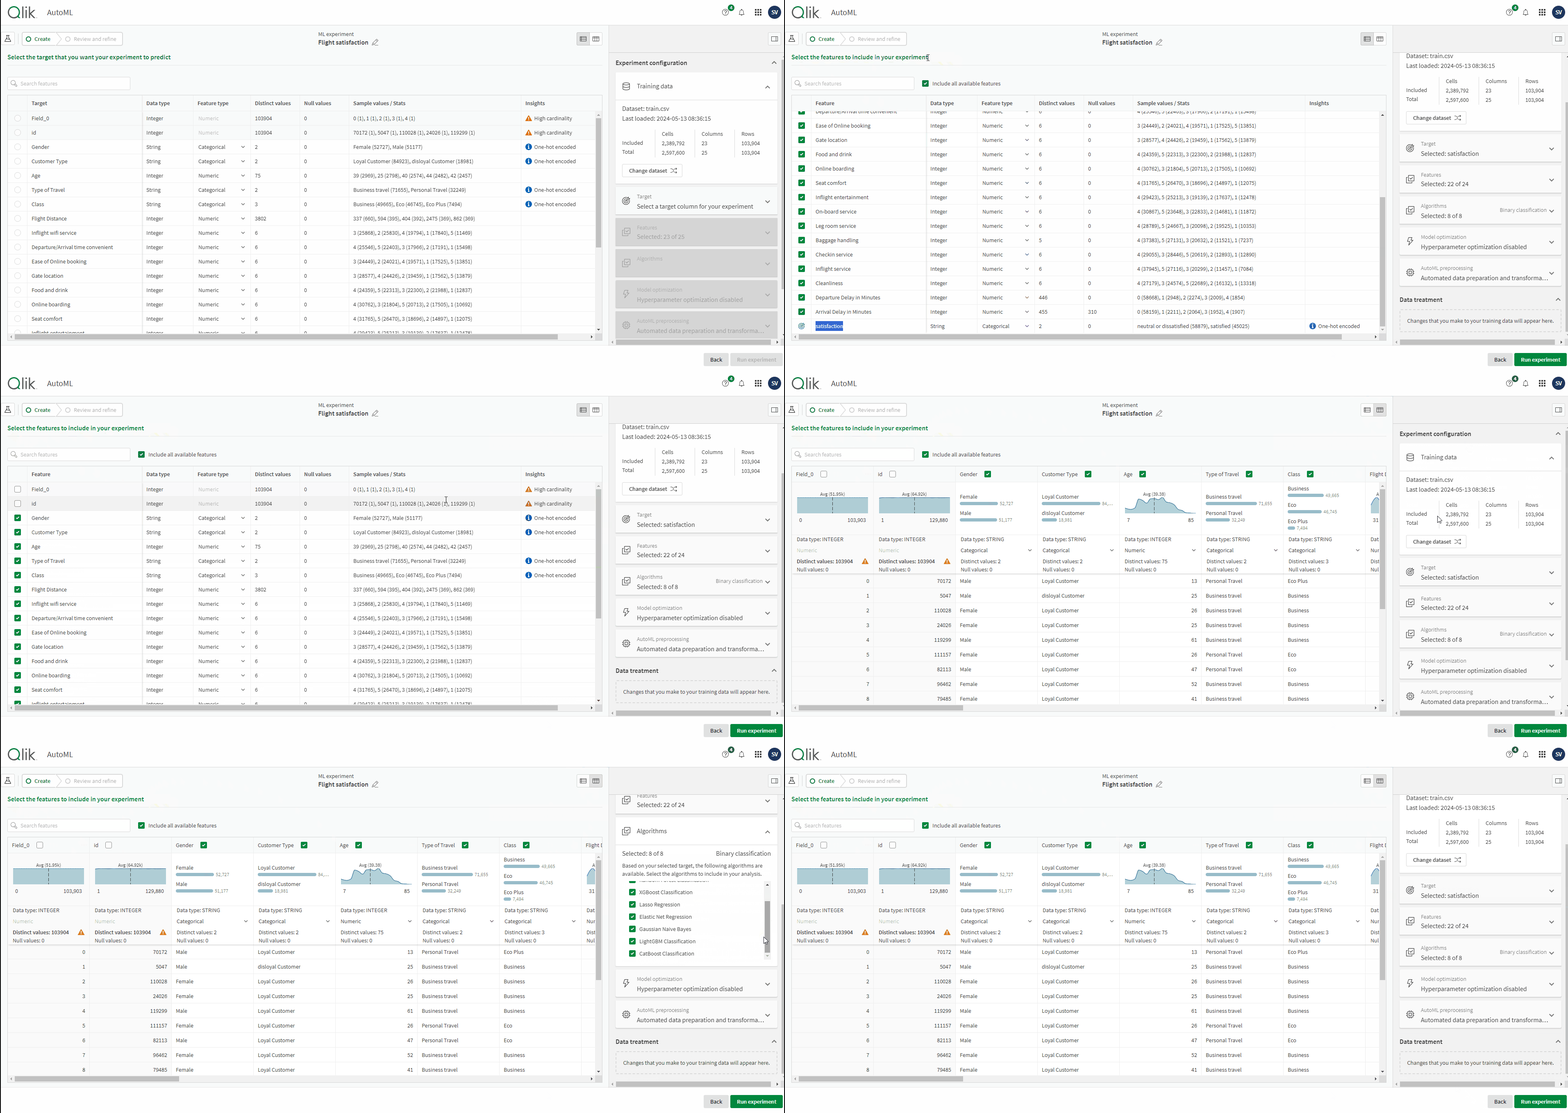
The process begins with the careful selection of a target variable—the outcome you wish to predict—and the identification of features that will inform the model's predictions. To aid in this selection, Qlik AutoML provides a comprehensive analysis of your historical data, complete with summary statistics for each column, ensuring you make informed decisions about your model's inputs.
Certain constraints may arise from the quality of your data, influencing how you can leverage different segments within your experiment. The 'Insights' feature within the schema view offers visibility into the unique attributes of each data field. This insight is crucial as it informs you of the data's compatibility with machine learning algorithms and how it will be interpreted during the model training process.
Beyond the basics, a suite of optional settings allows you to fine-tune your experiments to your specific needs. Qlik AutoML takes the guesswork out of data preparation by automatically applying a series of preprocessing steps, ensuring that your model is trained on clean and appropriate data. models. For those interested in the intricacies of data preprocessing, further details are readily available in Automatic data preparation and transformation.
Furthermore, Qlik AutoML intelligently determines the most suitable model category based on the type of the target. There are three primary model types to consider:
- Binary Classification: Ideal for scenarios where the prediction is dichotomous, such as determining customer satisfaction as either 'satisfied' or 'neutral/dissatisfied'.
- Multiclass Classification: Used when the prediction involves several possible outcomes, like classifying customer feedback into 'satisfied', 'neutral', or 'dissatisfied' categories.
- Regression: Applicable for predicting continuous numerical values, for instance, forecasting future sales figures.
Training experiments
The process of training machine learning models involves presenting data to algorithms, allowing them to discern and learn from the underlying patterns present. This foundational stage is critical, as it sets the stage for the model's ability to make predictions or decisions. Once the initial training phase is complete, the resulting metrics offer valuable insights into the model's performance. To start training, click on the 'Run experiment' button after you've finished configuring the experiment.
Refining models
Reviewing models
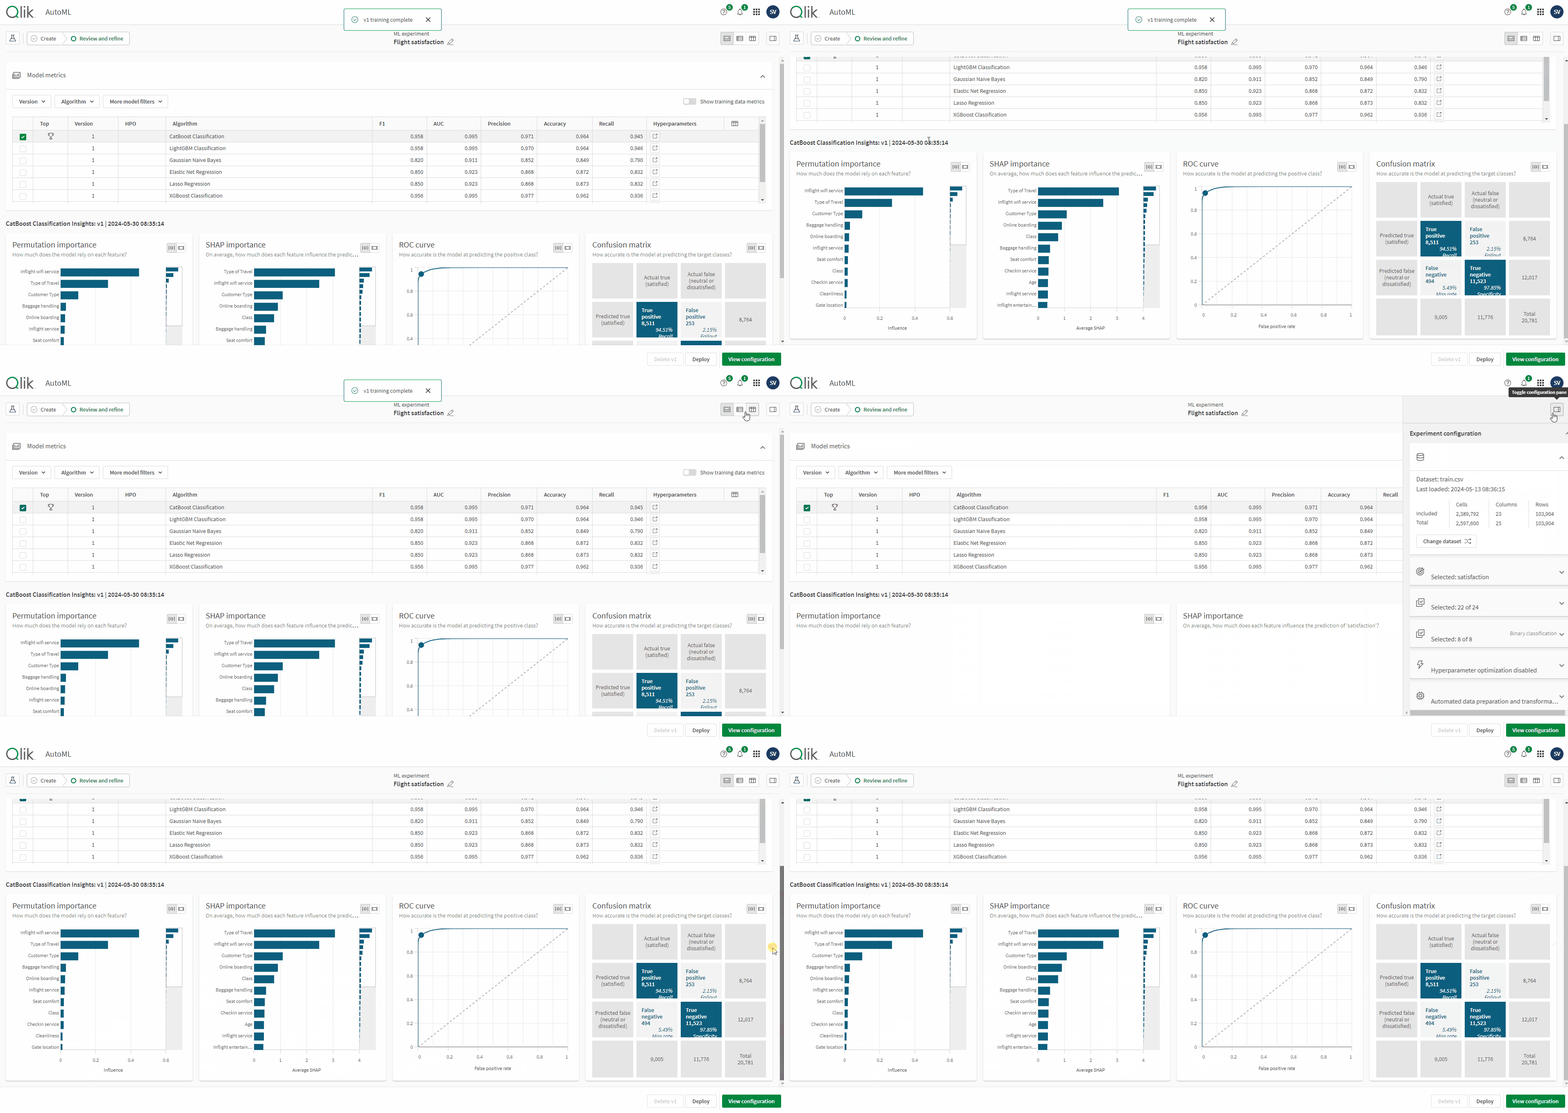
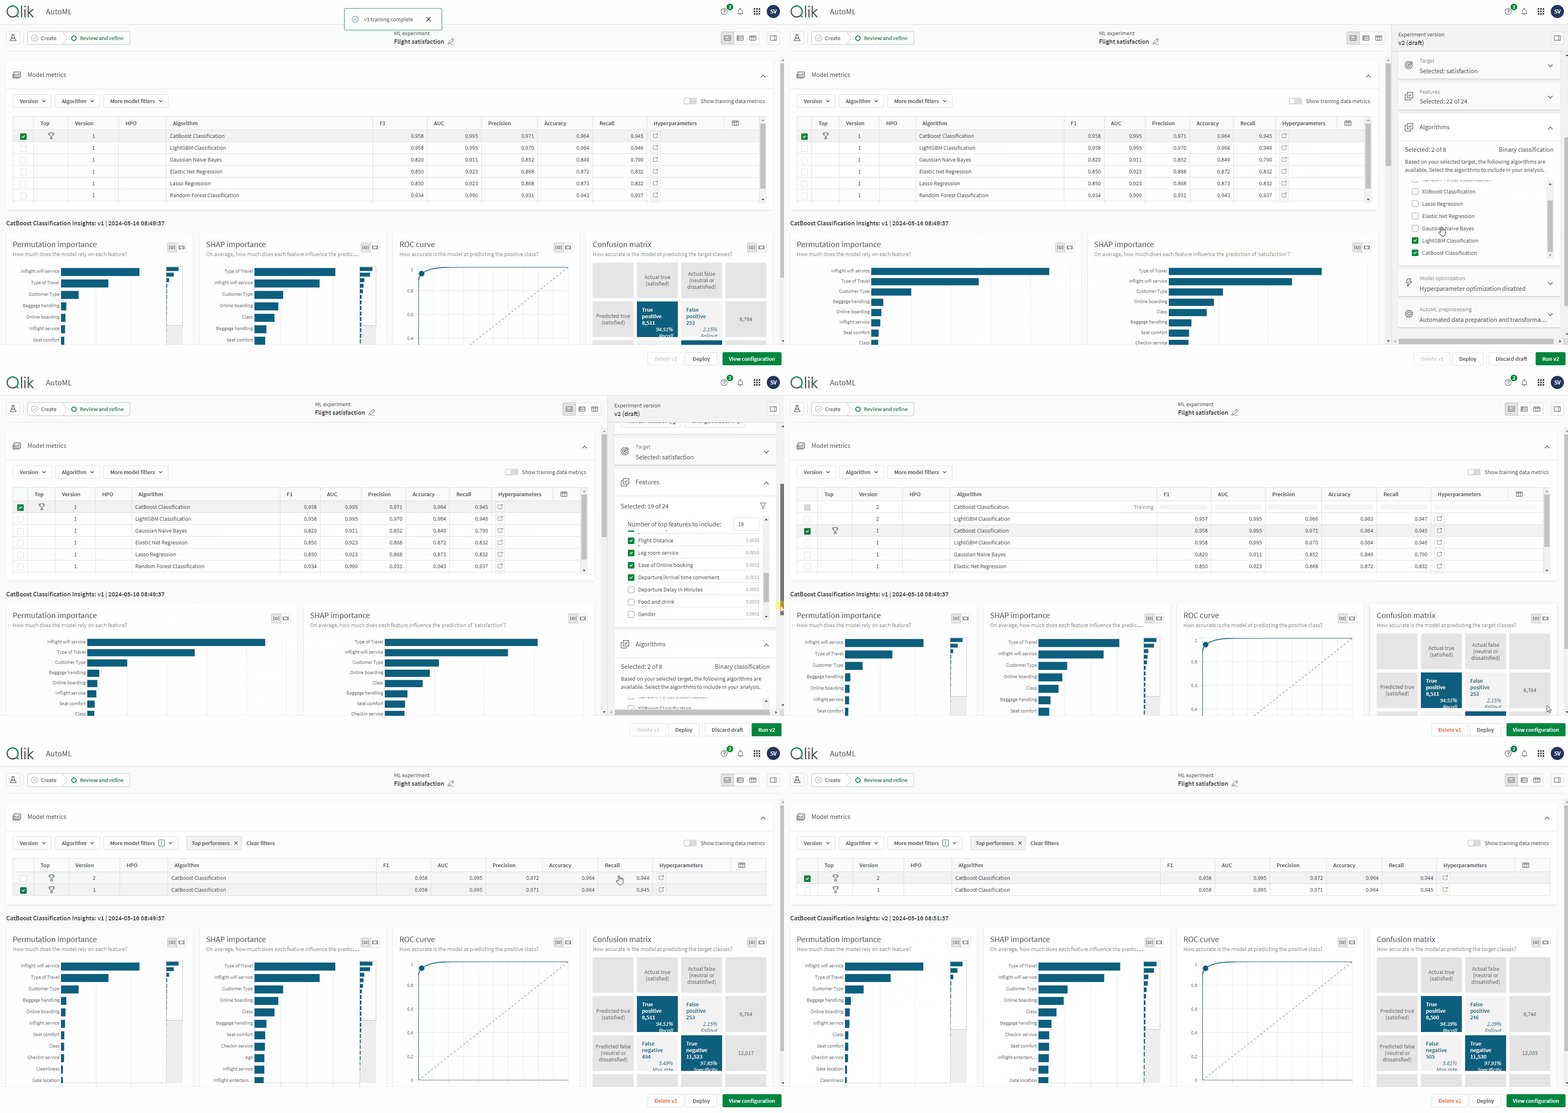
Below you can see the scoring of our models, the CatBoost classification was the top performer. Our example is a fairly simple one, resulting in very high scores on the first version. For more complex cases multiple iterations might be necessary. If you want to learn more about the different performance metrics, you can find more info here: Scoring binary classification models.
Refining models
After creating the first version of your models, the next critical step is to refine the models to maximize their accuracy and predictiveness.
Refinement of your models can be achieved by adjusting a variety of elements, including the inclusion or exclusion of specific features, updating the training dataset, and tweaking various configuration options. These changes allow you to perform side-by-side comparisons of different model iterations, giving you a clear view of the effects of your refinements. In our example, multiple features have a very low permutation score, meaning the model barely relies on them to make the prediction. These features can be seen as unnecessary noise. We will remove some of these features and re-train our model. Furthermore, we will only re-train the CatBoost Classification and LightGBM Classification as those models seem to perform the best on our data.
Deploying models
Deploying models
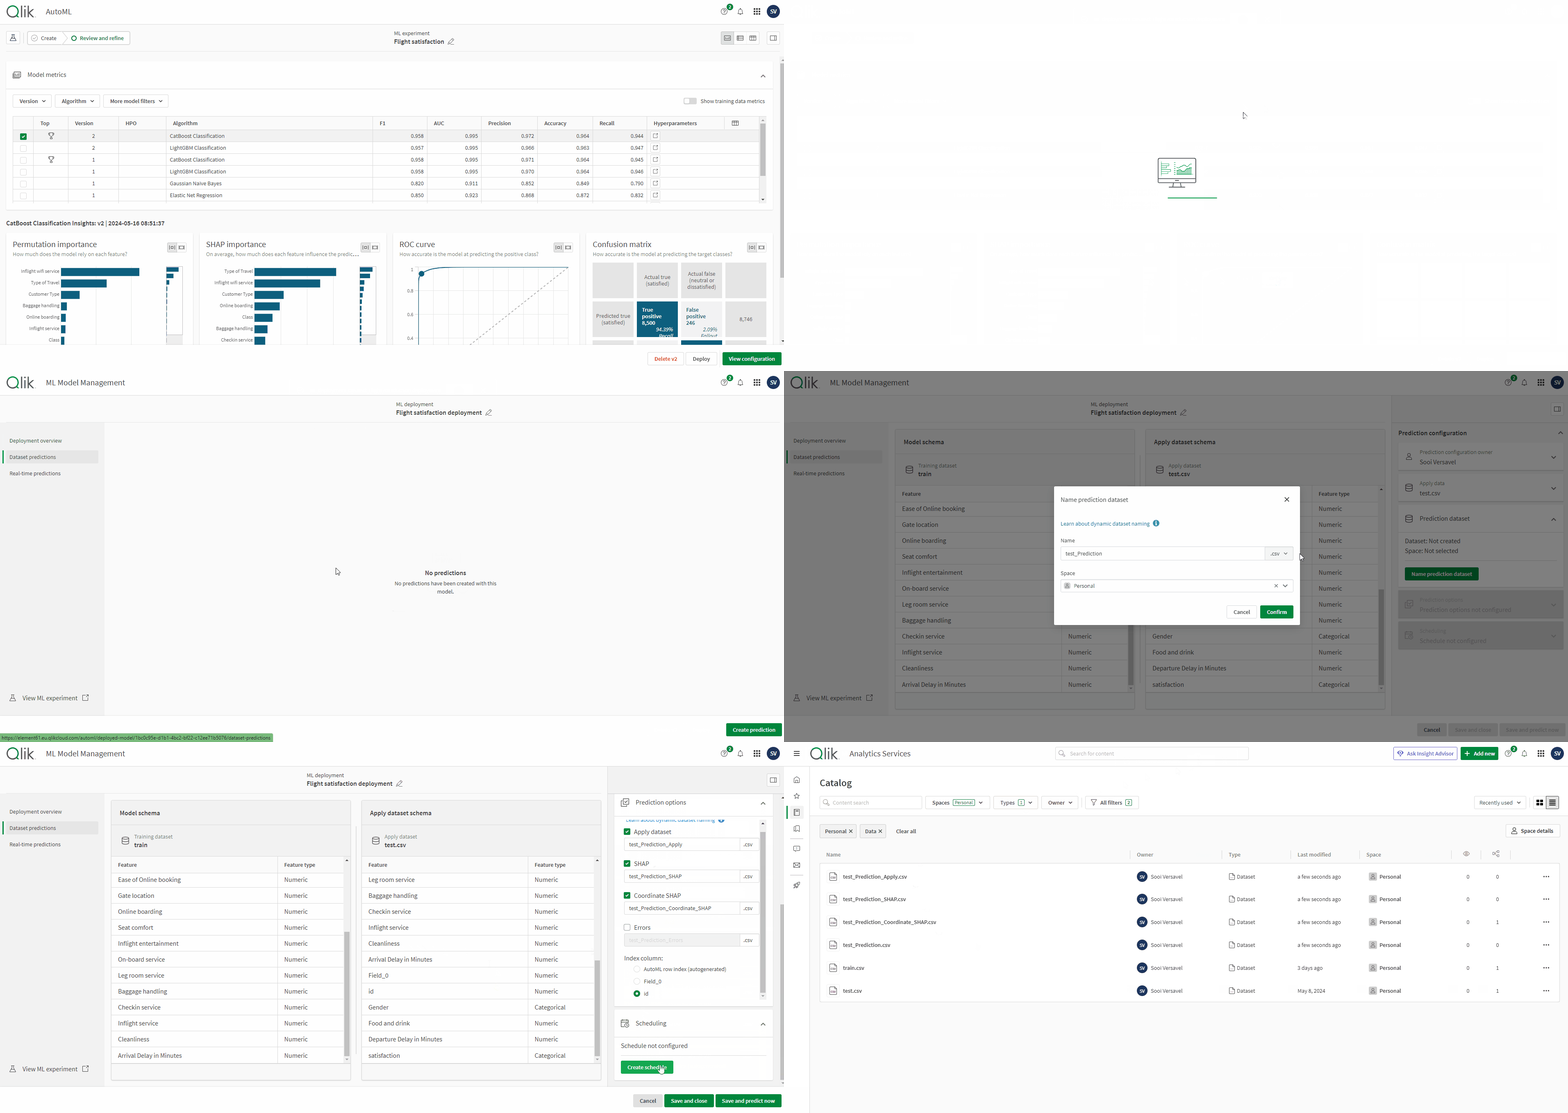
You can deploy machine learning models from your experiments into either personal or shared workspaces. For a more controlled environment, models can be published in managed spaces. It's important to note that each machine learning deployment originates from a single algorithm derived from one specific version of an experiment.
Your Qlik Cloud subscription tier determines the number of models you can deploy. This cap is applied across all tenants associated with your license. The limit is based on a per-model basis, which means that even if you deploy multiple instances from the same model, they collectively count as one deployed model towards your limit.
Should you reach the threshold of your deployment capacity, you have a couple of options: you can either remove some of the existing deployed models to make room for new ones or consider upgrading your subscription to a higher tier that accommodates a larger number of deployments.
Make predictions
When utilizing your machine learning model to make predictions, you have the option to generate various datasets that provide different insights into the prediction process. Here is an overview of the datasets you can create:
- Prediction_apply: This dataset is a replica of the data on which predictions are being made, allowing you to see the input that was fed into the model.
- Prediction_SHAP: This dataset presents the SHAP values for each feature across all predictions. SHAP values quantify the contribution of each feature to the prediction relative to a baseline. For instance, a SHAP value of 1.5 for 'inflight wifi service' suggests that the feature positively influences the likelihood of a passenger's satisfaction.
- Prediction_coordinate_SHAP: This dataset compiles all the SHAP values into a single column.
- Prediction: This dataset contains the actual predictions made by the model.
- Errors: This dataset includes any errors that occurred for records in the applied dataset. It provides details on which records were not processed and the reasons why, which is crucial for maintaining data integrity and troubleshooting the prediction process.
Each dataset serves a unique purpose and can be used to gain a deeper understanding of your model's predictions, as well as to identify and resolve any issues that may arise during the prediction process.
Visualize the predictive insights
SHAP values offer a window into both the overall behavior of a model and the factors influencing specific predictions. By integrating visualizations of SHAP values into Qlik Sense applications, you can delve deeper into your dataset. Presented below is a sample report that illustrates the outcomes of our predictive analysis. The data indicates that 'customer type' and 'type of travel' are the most significant predictors of a neutral or dissatisfied rating. Notably, customers flying in 'eco' or 'eco plus' classes, as well as those travelling for personal reasons, are more prone to report neutral or dissatisfaction with their experience.

Explore the data with what-if scenarios
Finally, you can leverage the prediction API to seamlessly integrate real-time predictive analytics into your application. This powerful feature allows you to conduct dynamic "what-if" analyses, a unique strength of Qlik AutoML that connects natively or to external platforms without delay. By altering feature values, you can simulate various scenarios and instantly observe how these changes might affect predicted outcomes. This capability is particularly valuable for exploring the impact of different factors on your business objectives. For example, you can assess how modifications to 'check-in services' or 'inflight wifi service' could potentially shift customer satisfaction levels. The data record is sent directly to the machine learning deployment via the API, and the predicted response is returned immediately, enabling you to make data-driven decisions swiftly. Discover how to implement this with Python and enhance your analytical toolkit on the Qlik Community post.
Conclusion
As we have explored, Qlik AutoML is a transformative force within the analytics landscape, offering a bridge between complex machine learning processes and business users seeking to harness the power of predictive analytics. By simplifying the creation, configuration, and deployment of machine learning models, Qlik AutoML empowers organizations to make forward-looking decisions with confidence and precision. The integration of Qlik AutoML into the Qlik Cloud Platform is a testament to the future of accessible, no-code AI solutions that cater to the needs of diverse users, regardless of their technical expertise.

