Introduction
Modern analytical tools like Power BI are designed to deliver results in a very fast and dynamic way. However, a problem in your data model or overcomplex calculations, can result in a slower report. 
How to investigate this? DAX Studio to the rescue! DAX, or Data Analysis Expressions, is the formula and query language behind Power BI and related technology. DAX Studio is a third-party tool that you can use to measure and improve the speed of DAX queries. You can download DAX Studio for free. DAX Studio is a client tool for executing queries against various data sources including:
- PowerPivot in Excel
- Power BI Desktop / SSDT Integrated Workspaces
- Analysis Services Tabular
- Azure Analysis Services
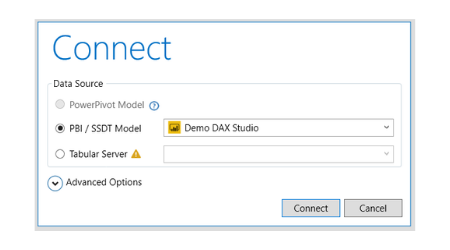
When starting DAX Studio, DAX Studio scans the local machine for any running instances of Power BI Desktop or SSDT Integrated Workspaces. These instances can then be used as a source to investigate the speed and complexity of the queries on this data.
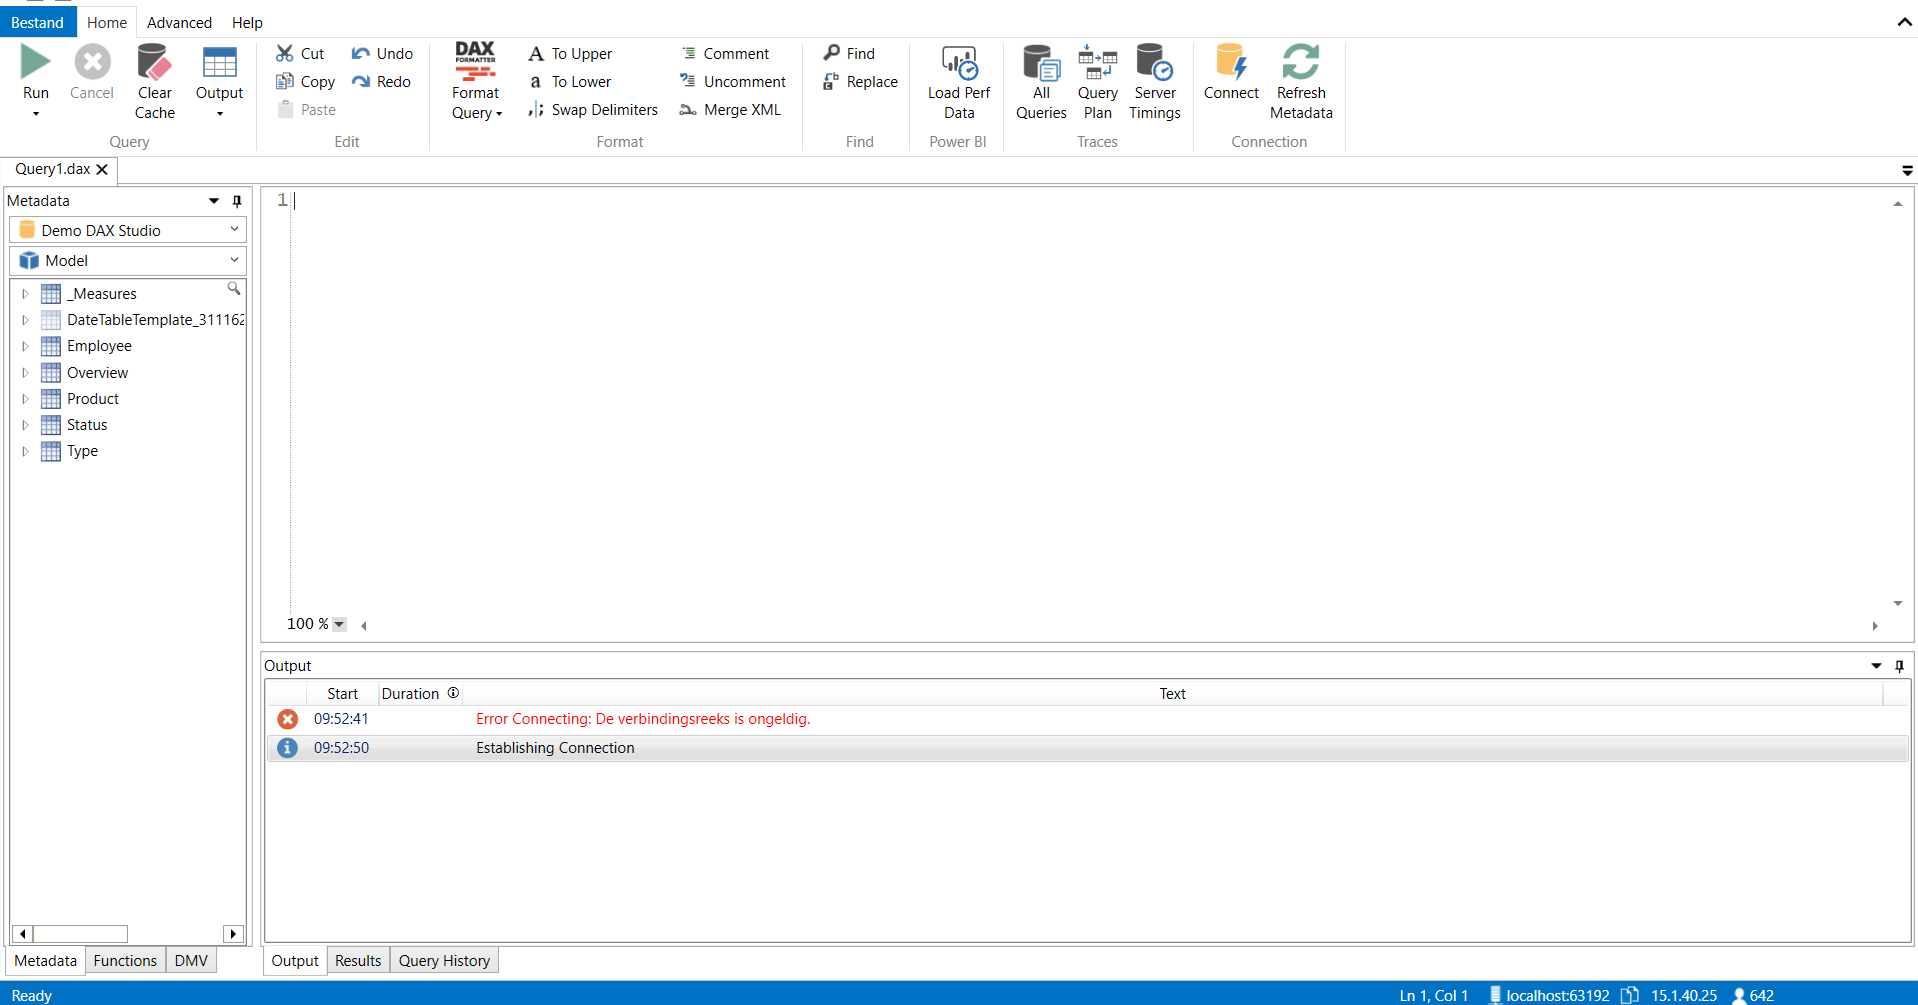
Interface of DAX Studio
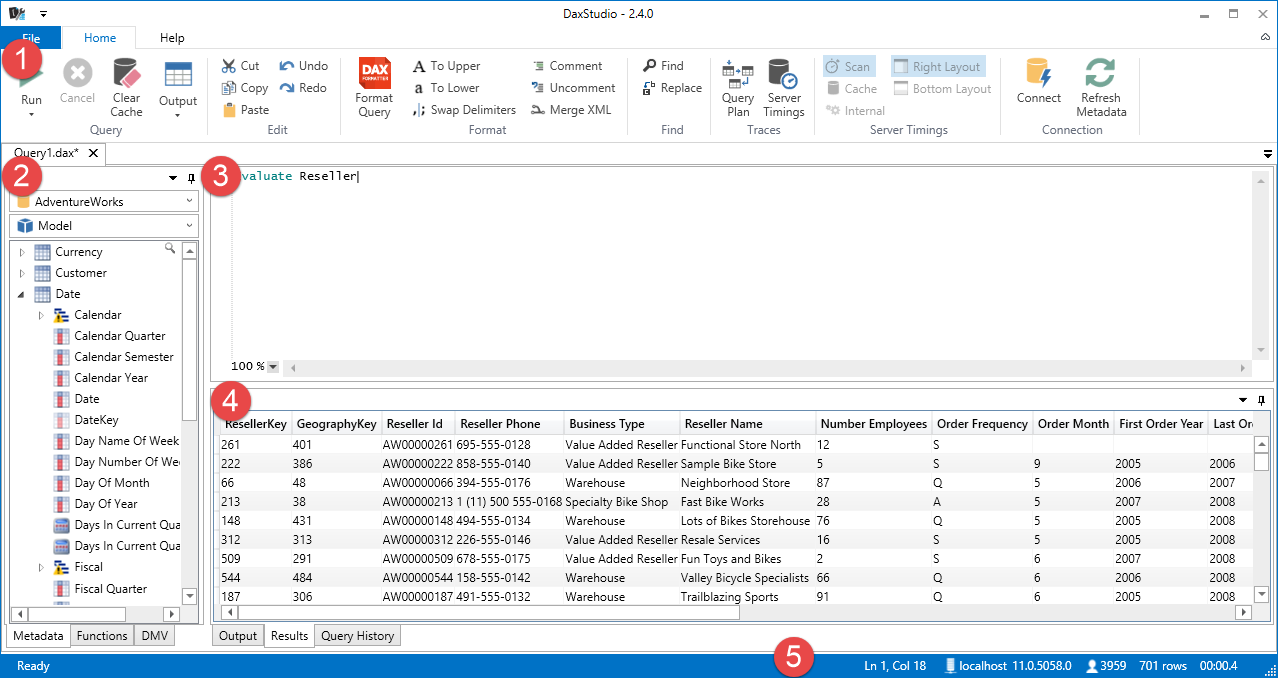
1. This is the ribbon. It is formatted like the Office 365 ribbon and like the recent versions of Power BI Desktop. This creates a recognizable look and feel. Everything that is present in the ribbon will be discussed later.
2. This part contains the tables and the various databases. Via a dropdown we can choose the database on which we want to test the queries. Under the dropdown we get an overview of which tables are present.
3. In the script editor we can enter the specific queries to execute.
4. This part of the interface displays the results.
5. The bottom ribbon provides additional information about the query executed.
The ribbon of DAX Studio
3.1 Query
A. Run
The Run statement contains 2 modes:
1. Run Query
This is the default mode, it will execute the selected query and sent the results to the selected output
2. Clear Cache and Run
In this mode before the query is run a clear cache command is sent to the connected instance to make sure that the query runs on a cold cache. During performance tuning it is really important to understand and investigate the impact of caching on your query.
B. Cancel
This will stop the execution of a running query.
C. Clear Cache
This will send a clear cache command to the connected instance so that the query will be run on an empty cache. This makes it possible to compare 2 almost similar queries without caching in the story.
D. Output
1. Grid
This is the default mode. Results are displayed in a grid within the Dax Studio Results tab.
2. Timer
In this mode the query is run, but the results are discarded. This is mainly useful for performance tuning where you want to measure the speed of two queries but are not interested in viewing the results.
3. File
Results can be sent directly to a tab separated (.txt) file or to a comma separated (.csv) file.
4. Linked (Excel only)
When the results are output using the Linked Excel mode a table is created in the active Excel workbook which has the connection to the Tabular data source and the DAX query embedded in it. What this means is that users without DAX Studio could refresh the data in this table.
5. Static (Excel only)
This output option simply executes the DAX query and copies the results into the specified sheet in the active Excel worksheet. This is just a static copy of the data which cannot be refreshed. (unlike the Linked output option)
3.2 Edit, Format & Find
These are tools to help shape the query, like you can find in Word, Excel, etc.
3.3 Traces
Note: Tracing requires server admin rights, if you do not have these the trace buttons will be disabled!
A. Query Plan
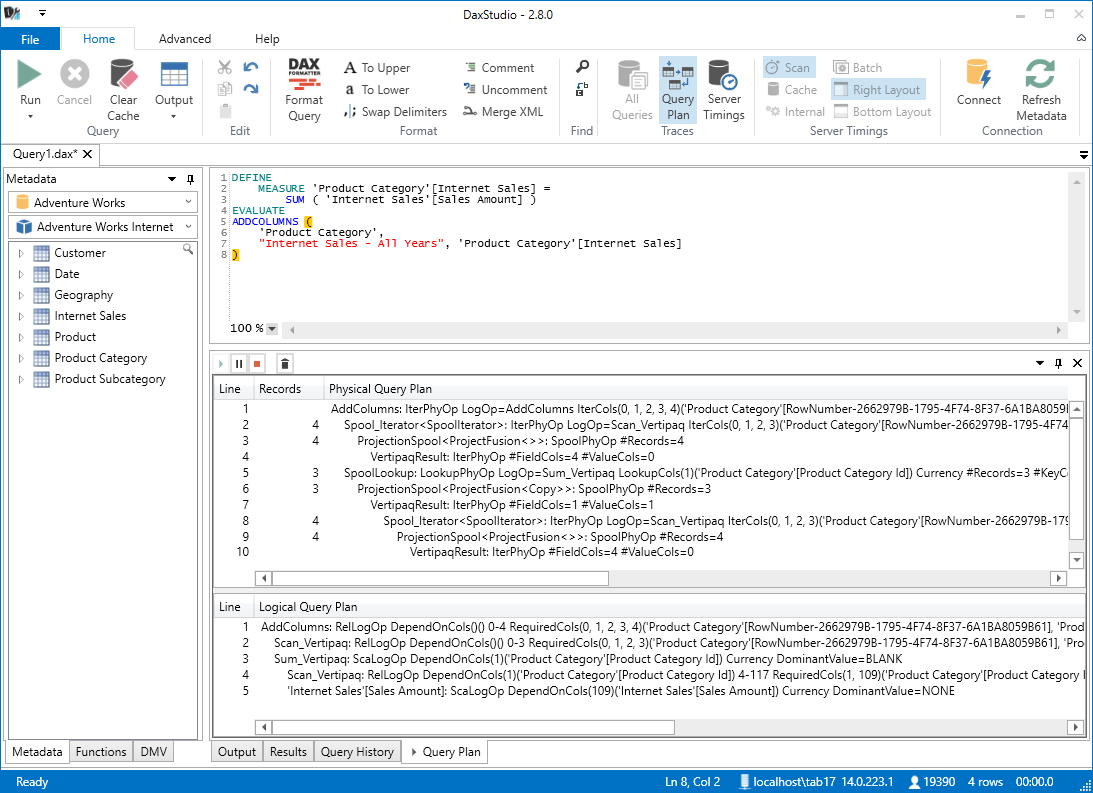
DAX Studio supports capturing the query plan trace events from a SSAS Tabular server and displaying them.
The Query Plan text is currently displayed in its raw form. In the future some pre-processing may be done to improve the readability. Currently it is not possible to get query plans from a Power Pivot connection.
B. Server Timings
The standard server timings reported in the output window are the elapsed time for the query recorded by DAX Studio, but that can be impacted by network speeds and the size of the result set. If you want to see the query timing from the server perspective, you can do this with the server timing trace button.
This button causes an extra tab to be displayed which shows the total time the server spent processing the query as well as the time spent in the Storage Engine and the number of Storage Engine requests for the query.
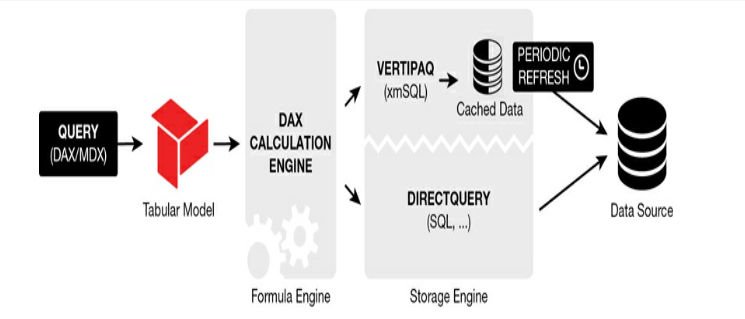
Each Query to retrieve a result set is divided between the Formula Engine and the Storage Engine. If the impact tilts to the Formula Engine then this formula needs to be reconsidered if it can be written more performant. The Formula Engine is single-threaded and will place all the ongoing queries of the Storage Engine on hold. A typical normal distribution should be around 1/5 FE and 4/5 SE.
The Storage Engine can handle simple aggregation formulas like SUM, AVG, ... However, a lot of measures in a complex model require a more complex calculation plan so these are first processed by the Formula Engine and therefore take longer to load. However, the Storage Engine is multi-threaded so all operations that the Storage Engine can record are a lot smoother as they can run parallel to each other.
The reports/visual that go slower, usually contain a more complex DAX formula. The Formula Engine is the engine that will load the RAM memory because of the demand for and processing of data. The Storage Engine iterates over the data that is compressed in the VertiPaq column stores (in RAM memory) and will place the data of the disk in the RAM memory if it isn’t already.
The queries must be made in such a way that they will spend a minimal amount of time in the Formula Engine.
3.4 Connection
A. Connect
Allows you to connect to a source.
B. Refresh Metadata
Will retrieve and renew all metadata from the source.
Example of a query in DAX Studio
The first step is to choose a data source. In this example I quickly created a PBIX with some tables. These tables will be used as data source for this example. The PBIX consists of 1 fact table (Overview) and 4 dimensions (Employee, Product, Status and Type).
When everything is loaded you will find all tables and fields of the chosen data source in the left column of the screen (see next screenshot).
There are several ways to validate and evaluate a query. First of all, you can copy the query from a visual from Power BI Desktop. This is possible to use the Performance Analyzer in Power BI Desktop. This can be found in the ribbon under View. After that you can refresh the data and unfold the visual and copy and paste the query in DAX Studio. Another way is to write the query yourself in DAX Studio . It is also very important to know that DAX Studio can only perform Table functions. Example of what the syntax can look like can be found below:
[DEFINE { MEASURE <tableName>[<name>] = <expression> }
{ VAR <name> = <expression>}]
EVALUATE <table>
[ORDER BY {<expression> [{ASC | DESC}]}[, …]
[START AT {<value>|<parameter>} [, …]]]
If you want to get a single value you can use the example below:
EVALUATE ROW(<ColumnName>, <Expression>)
After drawing up the query, it is possible to start analyzing it. To do so, we follow the steps in the screenshot below:
1. Formatting the query
2. Use the 'Server Timings' button
3. Run the query (with or without emptying cache)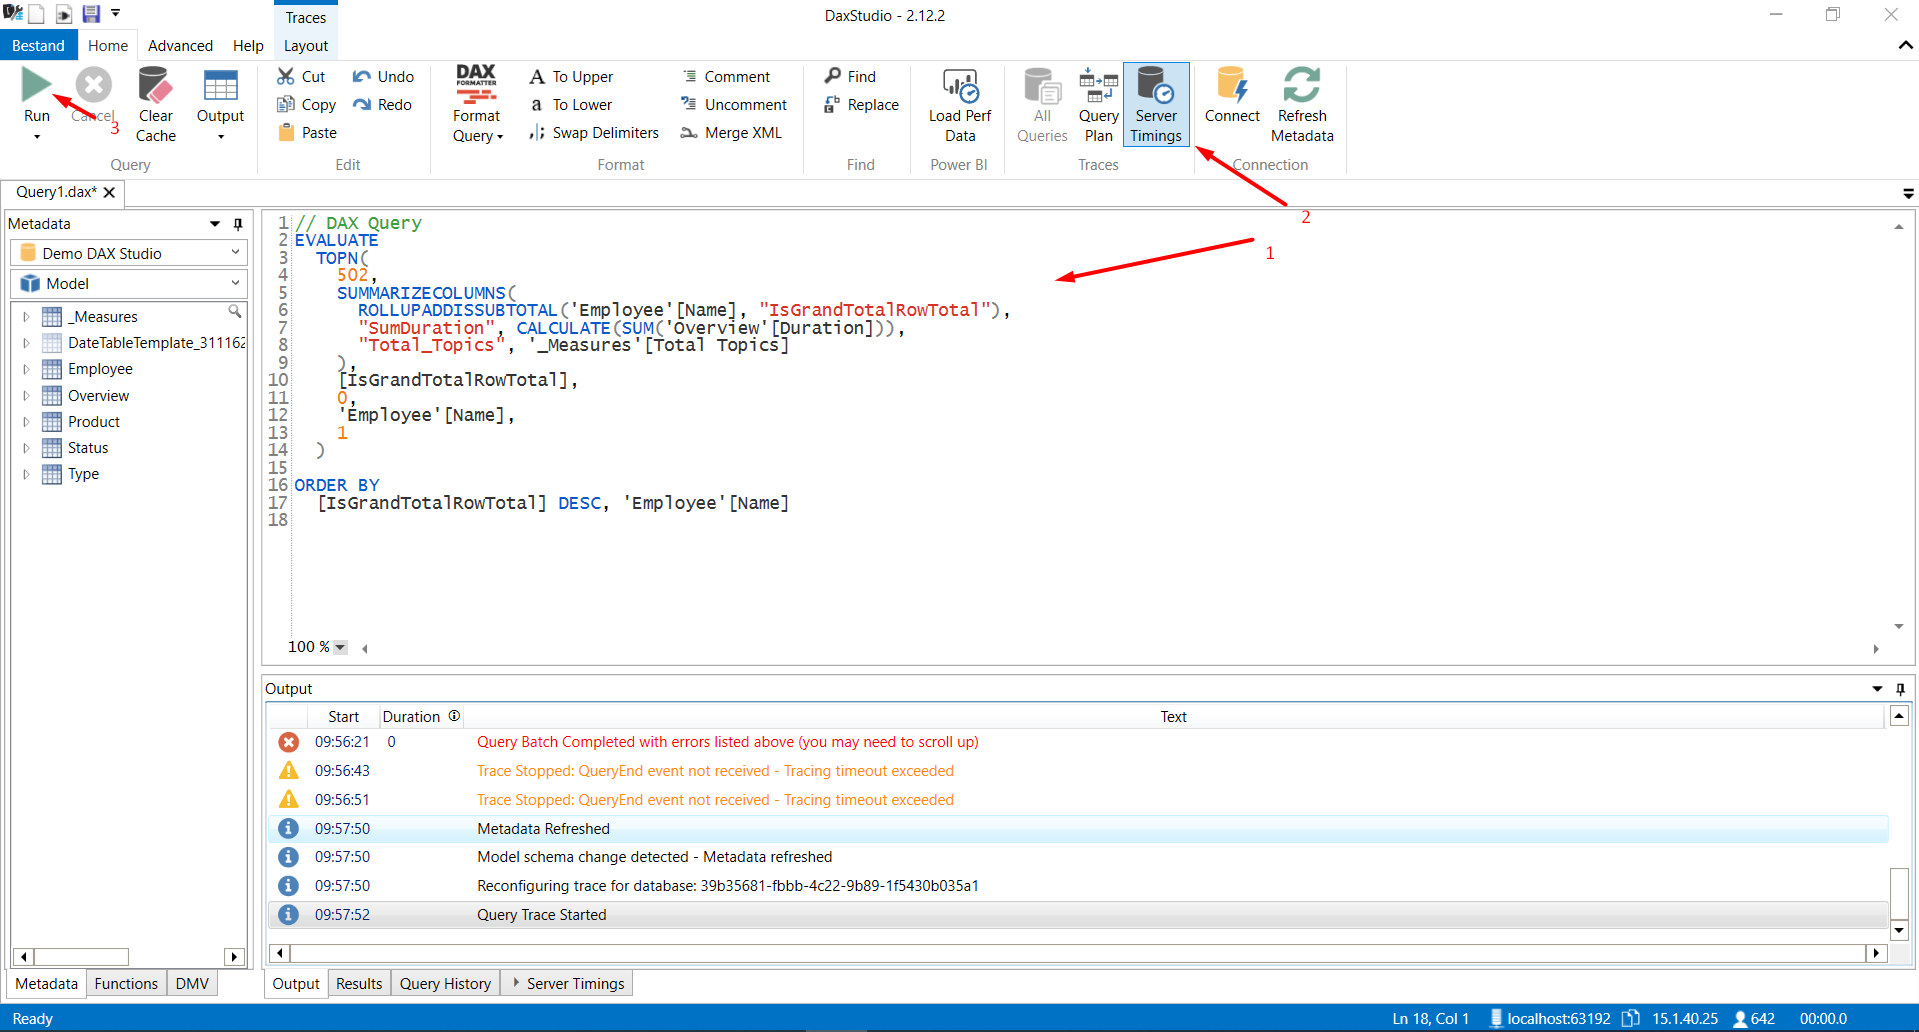
Then we can start analyzing the outcome. This can be found at the bottom of the screen. When the button 'Server Timings' is selected you will get an extra tab at the outputs. This tab shows how many queries have been executed and how much time they took. Finally, you can also see how much time the query has spent in the Formula Engine and how much time in the Storage Engine. Based on this outcome queries & models can be adjusted to improve performance as discussed in the side note in this Insight.
For more information visit the DAX Studio Documentation page:
https://daxstudio.org/documentation/.
More information
Continue reading or contact us to get started:
